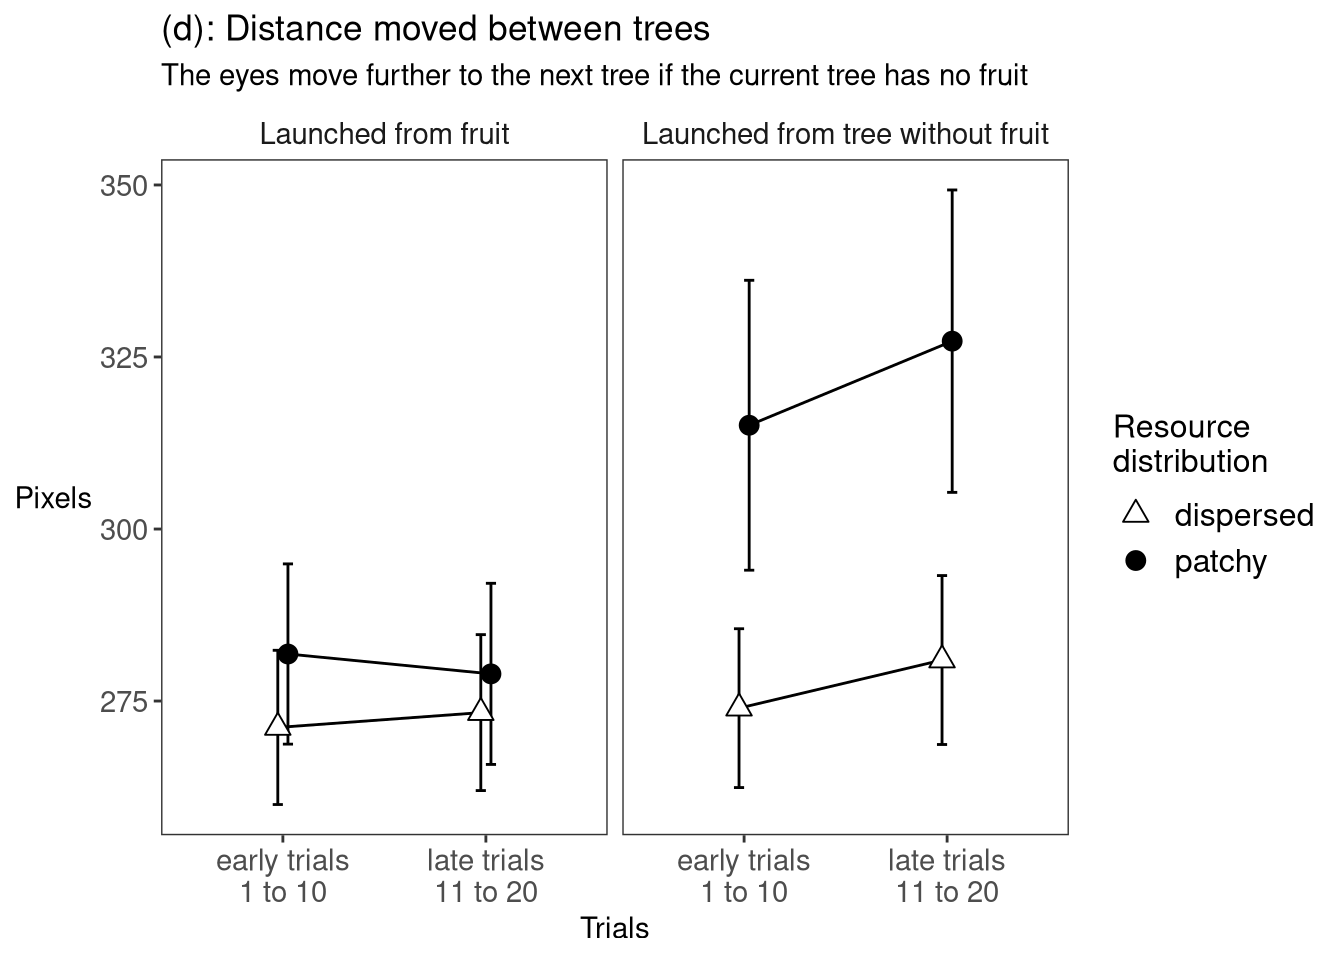
The Euclidian distance between successive tree-visits, in units of pixels.
E2 Distance - Prepare the data
Show the code
e2 <-readRDS("002-00-e2-data.RDS")# remove things from the raw data to make it # suitable for this particular analysis# remove samples that did not look at a treee2 <- e2 %>%filter(fl>0)# remove the second (and any subsequent) *consecutive* duplicatese2 <- e2 %>%group_by(pp, rr, tb) %>%filter(is.na(tl !=lag(tl)) | tl !=lag(tl)) %>%ungroup()# remove trials where they failed to get 14 fruite2 <- e2 %>%group_by(pp, rr, tb) %>%mutate(max_fr =max(fr)) %>%ungroup() %>%filter(max_fr==14) # Euclide2 <- e2 %>%group_by(pp, rr, tb) %>%mutate(dist =round(sqrt((lead(xx)-xx)^2+ (lead(yy)-yy)^2), 2)) %>%ungroup()# timee2 <- e2 %>%group_by(pp, rr, tb) %>%mutate(tm=tm-first(tm)) %>%ungroup()e2 <- e2 %>%rename(ll=ln)# fewer columnse2 <- e2 %>%select(ff, pp, rr, st, tb, tm, ll, tl, dist)e2 <- e2 %>%mutate(ff=as_factor(ff),pp=as_factor(pp), st=as_factor(st), tb=as_factor(tb),ll=factor(ll, levels=c("fruit", "not"), labels=c("Launched from fruit", "Launched from tree without fruit" )),rr=factor(rr, levels=c("dispersed", "patchy")), )dst <- e2 %>%group_by(ff, pp, rr, st, ll, tb) %>%# average over tree-visits yielding# two values for each trial, # one for launch from fruit, # one for launch from emptysummarise(dist=mean(dist, na.rm=TRUE)) %>%arrange(ff, pp, rr, st, ll, tb, .by_group =TRUE) %>%ungroup()# average over trials in each of the two stages,# to yield one row for each launch type, per stage# 8 rows per subject, 2 x 2 x 2# 2 x 2 x 2 x 42=336 rowsdst <- dst %>%group_by(ff, pp, rr, st, ll) %>%summarise(mu.dist=mean(dist, na.rm=TRUE)) %>%ungroup()dst <- dst %>%select(ff, rr, st, ll, pp, mu.dist) %>%arrange(ff, rr, st, ll, pp, mu.dist)saveRDS(dst, "e2_distance_data.rds")
The effect of fading was F(1, 40) = 0.80, p=0.375.
The effect of resources was F(1, 40) = 35.46, p<.001.
The effect of stage was F(1, 40) = 3.64, p=0.064.
The effect of stage was F(1, 40) = 28.98, p<.001.
2-way interactions
The resources x launch interaction was F(1, 40) = 23.61, p<.001.
The stage x launch interaction was F(1, 40) = 4.20, p<.05.
e2 Distance: Plot
x axis is stage; y axis is distance; group is resources; panel is launch site type
Show the code
ggplot(data=dst, aes(y=mu.dist, x=st, group=rr, fill=rr, shape=rr)) +facet_wrap(~ll) +labs(title="(d): Distance moved between trees", subtitle ="The eyes move further to the next tree if the current tree has no fruit")+ylab("Pixels")+xlab("Trials")+ my_fgms_theme+scale_fill_manual(name="Resource\ndistribution",values=c("white", "black")) +scale_shape_manual(name="Resource\ndistribution",values=c(24,19)) +stat_summary(fun.data = mean_cl_normal, geom ="errorbar", width=0.1, position=pd) +stat_summary(fun = mean, geom ="line", position=pd) +stat_summary(fun = mean, geom ="point", size=3, position=pd)+scale_x_discrete(labels=c("early trials\n1 to 10", "late trials\n11 to 20"))