pd <- position_dodge(0.1)
my_fgms_theme = theme_bw()+
theme(
panel.grid = element_blank(),
axis.title.y = element_text(angle=0, vjust=0.5, hjust=0.5),
legend.text = element_text(size=12),
legend.title = element_text(size=12),
axis.text = element_text(size=11),
strip.background = element_blank(),
strip.text = element_text(size=11)
)
d1=readRDS("e1_ntrees_plot_data.rds")
p1=ggplot(data=d1, aes(x=st, y=mean_ntrees_per_stage, group=rr, fill=rr, shape=rr)
) +
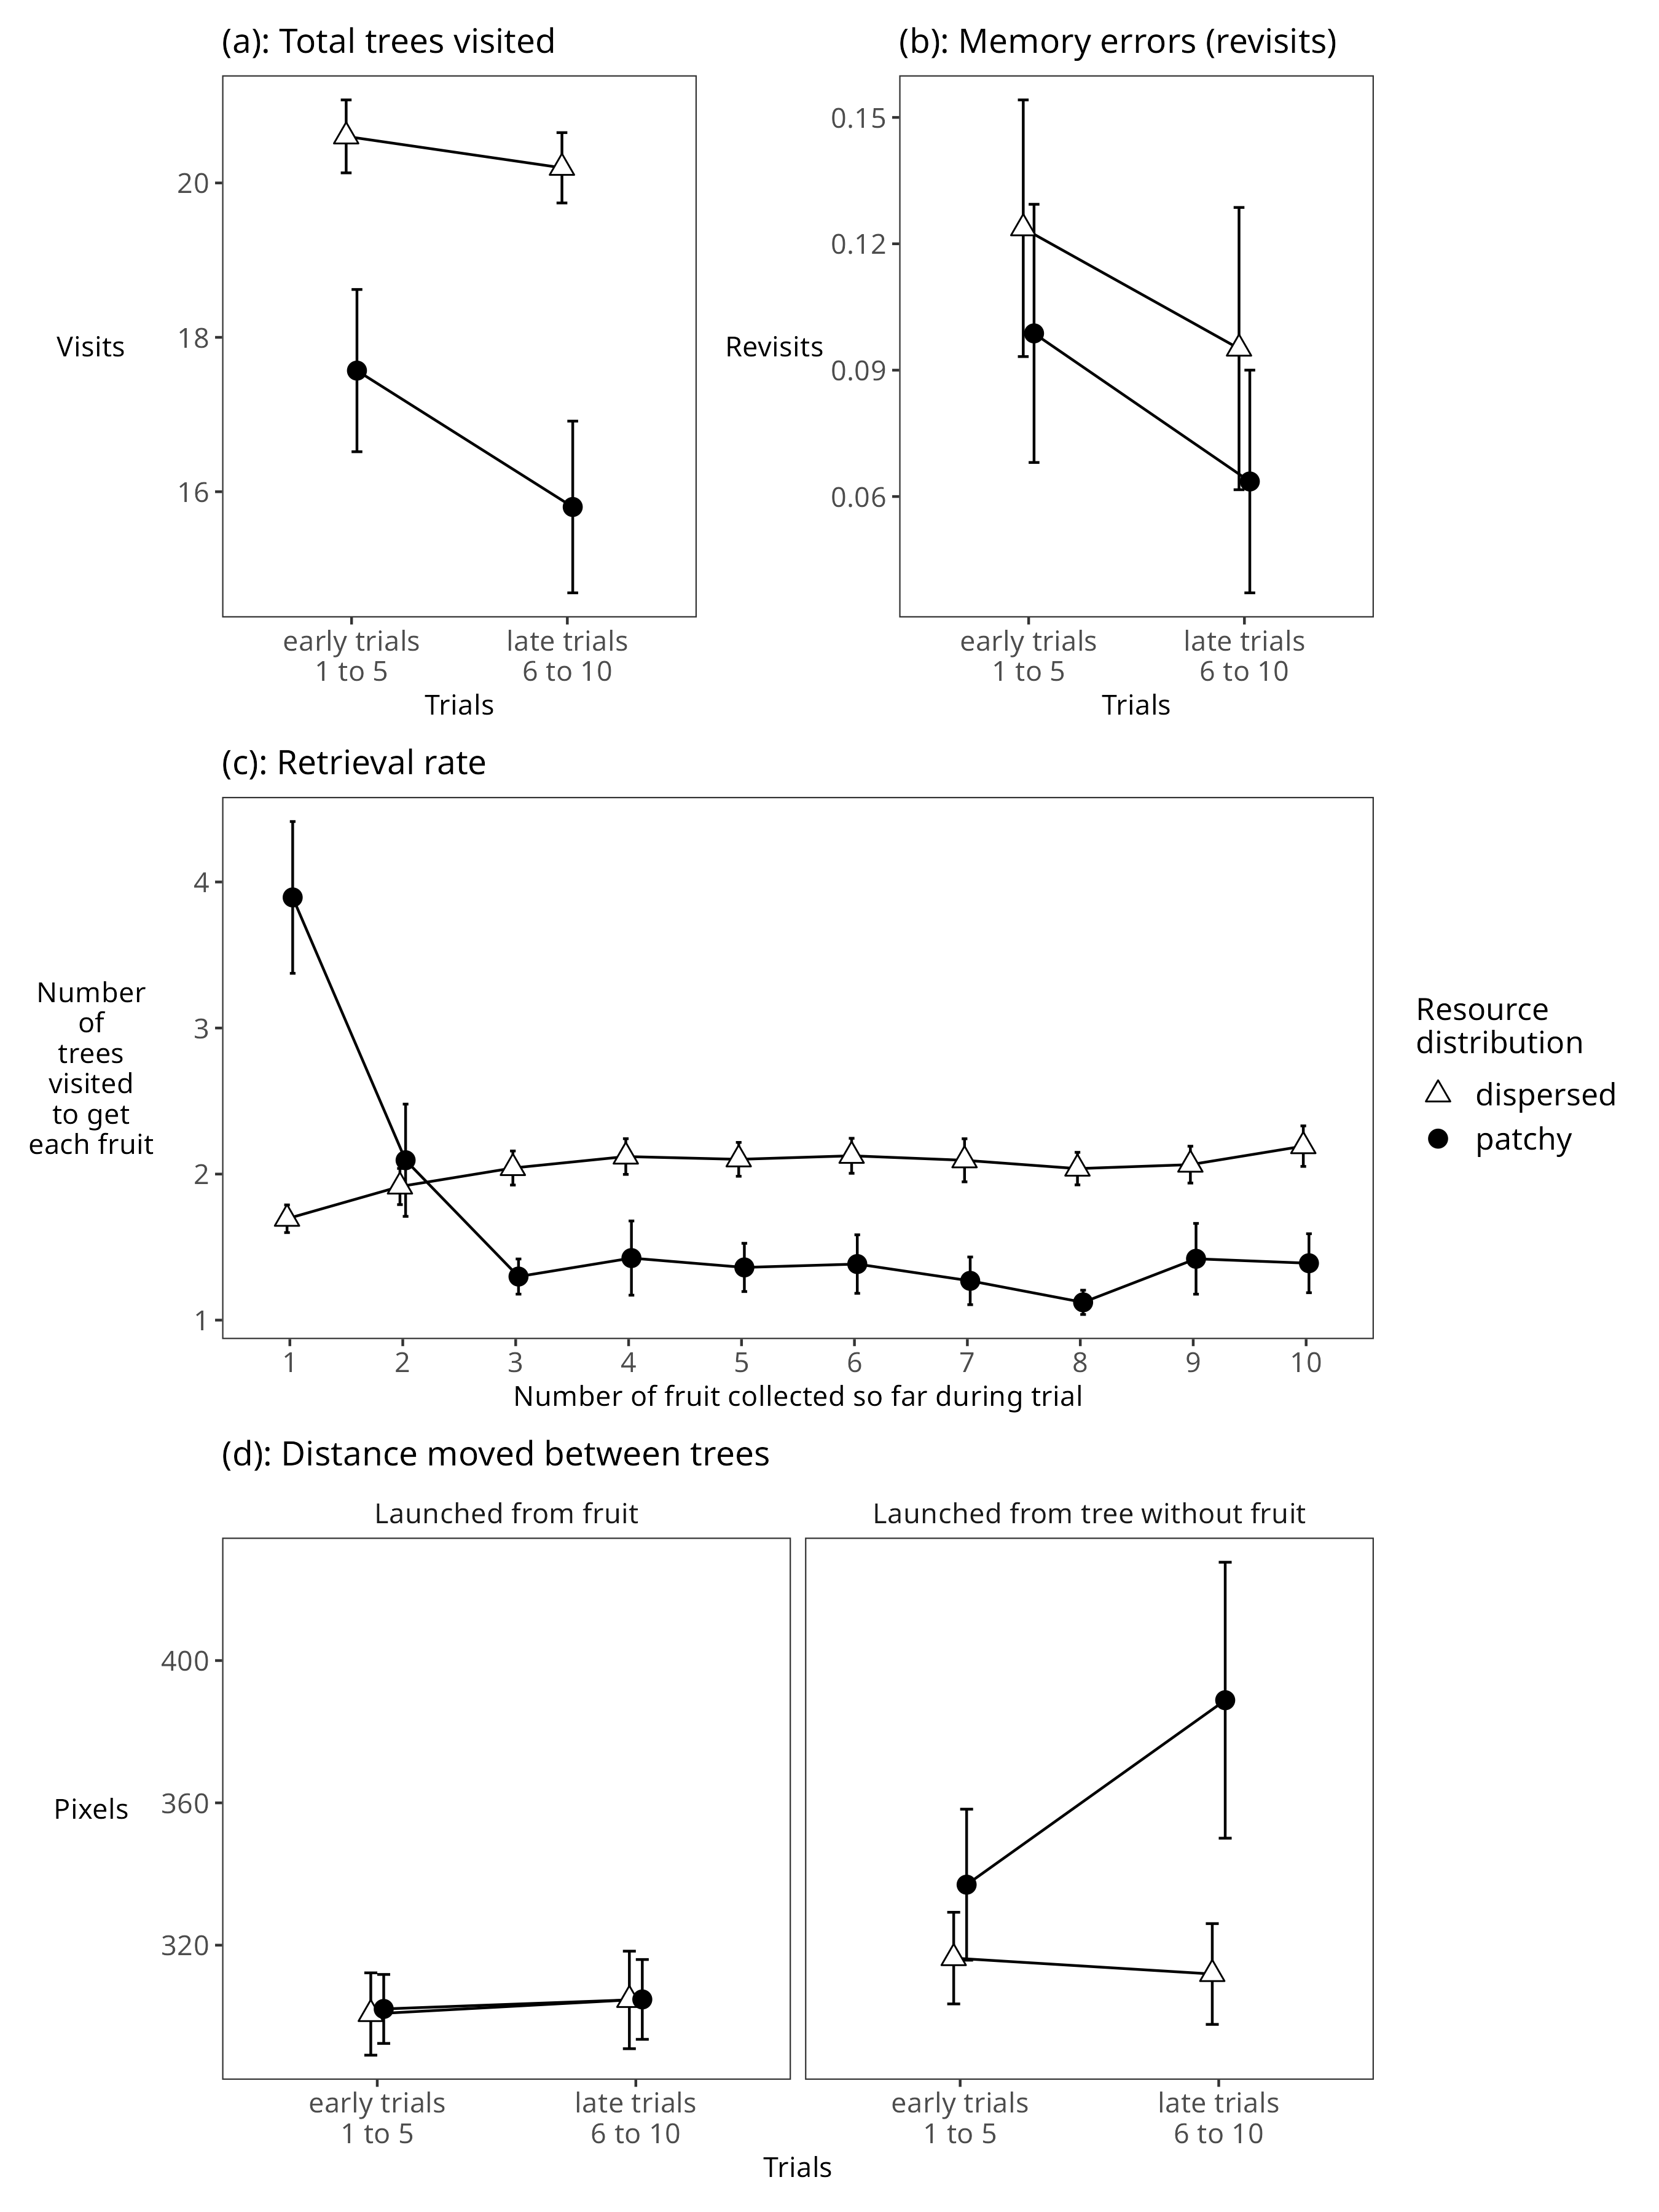
ggtitle("(a): Total trees visited")+
ylab("Visits")+
xlab("Trials")+
my_fgms_theme+
scale_fill_manual(name="Resource\ndistribution",values=c("white", "black")) +
scale_shape_manual(name="Resource\ndistribution",values=c(24,19)) +
stat_summary(fun.data = mean_cl_normal, geom = "errorbar", width=0.1, position=pd) +
stat_summary(fun = mean, geom = "line", position=pd) +
stat_summary(fun = mean, geom = "point", size=3, position=pd)+
scale_x_discrete(labels=c("early trials\n1 to 5", "late trials\n6 to 10"))
d2=readRDS("e1_nrevisits_plot_data.rds")
p2=ggplot(data=d2, aes(y=nrv, x=st, group=rr, fill=rr, shape=rr))+
ggtitle("(b): Memory errors (revisits)")+
ylab("Revisits")+
xlab("Trials")+
my_fgms_theme+
scale_fill_manual(name="Resource\ndistribution",values=c("white", "black")) +
scale_shape_manual(name="Resource\ndistribution",values=c(24,19)) +
stat_summary(fun.data = mean_cl_normal, geom = "errorbar", width=0.1, position=pd) +
stat_summary(fun = mean, geom = "line", position=pd) +
stat_summary(fun = mean, geom = "point", size=3, position=pd)+
scale_x_discrete(labels=c("early trials\n1 to 5", "late trials\n6 to 10"))
d3=readRDS("e1_retrieval_plot_data.rds")
p3=ggplot(data=d3, aes(y=mu, x=fr, group=rr, fill=rr, shape=rr))+
labs(title="(c): Retrieval rate")+#, subtitle="People benefit from being in a patch once they realise they are in one")+
ylab("Number\nof\ntrees\nvisited\nto get\neach fruit")+
xlab("Number of fruit collected so far during trial")+
my_fgms_theme+
scale_fill_manual(name="Resource\ndistribution",values=c("white", "black")) +
scale_shape_manual(name="Resource\ndistribution",values=c(24,19)) +
stat_summary(fun.data = mean_cl_normal, geom = "errorbar", width=0.1, position=pd) +
stat_summary(fun = mean, geom = "line", position=pd) +
stat_summary(fun = mean, geom = "point", size=3, position=pd)
d4=readRDS("e1_distance_data.rds")
p4=ggplot(data=d4, aes(y=mu.dist, x=st, group=rr, fill=rr, shape=rr)) +
facet_wrap(~ll) +
labs(title="(d): Distance moved between trees")+#, subtitle = "The eyes move further to the next tree if the current tree has no fruit")+
ylab("Pixels")+
xlab("Trials")+
my_fgms_theme+
scale_fill_manual(name="Resource\ndistribution",values=c("white", "black")) +
scale_shape_manual(name="Resource\ndistribution",values=c(24,19)) +
stat_summary(fun.data = mean_cl_normal, geom = "errorbar", width=0.1, position=pd) +
stat_summary(fun = mean, geom = "line", position=pd) +
stat_summary(fun = mean, geom = "point", size=3, position=pd)+
scale_x_discrete(labels=c("early trials\n1 to 5", "late trials\n6 to 10"))
pp=(p1+p2)/p3/p4 +
plot_layout(heights = c(1, 1, 1), guides="collect")
ggsave(filename="e1-99-master-plot.png", plot=pp, device="png", width=9, height=12)